# 列出MySQL服务器运行各种状态值
show global status;
# 查询MySQL服务器配置信息语句
show variables;
# 慢查询
show variables like '%slow%';
# MySQL服务器最大连接数
show variables like 'max_connections';
# 服务器响应的最大连接数
show global status like 'Max_used_connections';
# 查看试图连接到MySQL(不管是否连接成功)的连接数
show status like 'connections';
# 创建临时表
show global status like 'created_tmp%';
# MySQL服务器对临时表的配置
show variables where Variable_name in ('tmp_table_size', 'max_heap_table_size');
# 打开表的数量
show global status like 'open%tables%';
# table高速缓存的数量
show variables like 'table_open_cache';
# 查看MySQL服务器的线程信息
show global status like 'Thread%';
# 查看当前运行的sql
SELECT * FROM `information_schema`.`PROCESSLIST` WHERE `info` IS NOT NULL and TIME > 0
# 当客户端断开之后,服务器处理此客户的线程将会缓存起来以响应下一个客户而不是销毁(前提是缓存数未达上限)
show variables like 'thread_cache_size';
# 查询缓存
show global status like 'qcache%';
# 查询缓存适用于特定的场景,建议充分测试后,再考虑开启,避免引起性能下降或引入其他问题
show variables like 'query_cache%';
# 排序使用情况
show global status like 'sort%';
# 文件打开数
show global status like 'open_files';
# 表锁情况
show global status like 'table_locks%';
# 表扫描情况
show global status like 'handler_read%';
# 服务器完成的查询请求
show global status like 'com_select';
# 查询当前MySQL本次启动后的运行统计时间
show status like 'uptime';
# 查看本次MySQL启动后执行的select语句的次数
show status like 'com_select';
# 查看本次MySQL启动后执行insert语句的次数
show global status like 'com_insert';
# 查看本次MySQL启动后执行update语句的次数
show global status like 'com_update';
# 查看本次MySQL启动后执行delete语句的次数
show global status like 'com_delete';
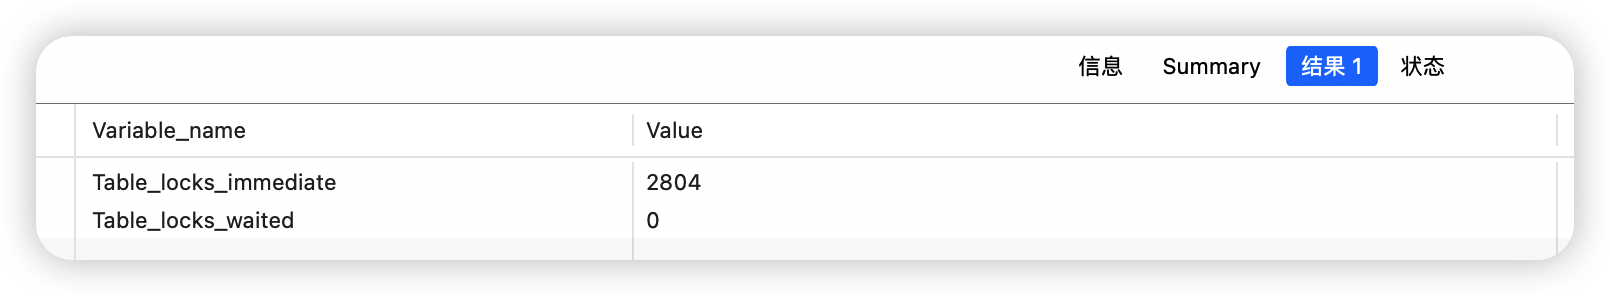
# 查看立即获得的表的锁的次数
show status like 'table_locks_immediate';
# 查看不能立即获得的表的锁的次数。如果该值较高,并且有性能问题,你应首先优化查询,然后拆分表或使用复制
show status like 'table_locks_waited';
# 查看查询时间超过long_query_time秒的查询的个数
show status like 'slow_queries';
# 通过mysql自带profiling(性能分析)工具可以诊断某个sql各个执行阶段消耗的时间,每个执行阶段在cpu disk io等方面的消耗情况。
show variables like '%profiling%';
#
show profiles
show profile for query 2;
show profile cpu, block io for query 2;
# 列出MySQL服务器运行各种状态值
show global status;
# 慢查询
show variables like '%slow%';

MySQL: ERROR 1040: Too many connections
一种是访问量确实很高,MySQL服务器抗不住,这个时候就要考虑增加从服务器分散读压力,另外一种情况是MySQL配置文件中max_connections值过小:
# MySQL服务器最大连接数
show variables like 'max_connections';

# 服务器响应的最大连接数
show global status like 'Max_used_connections';

Max_used_connections / max_connections * 100% ≈ 85%
# 创建临时表
show global status like 'created_tmp%';
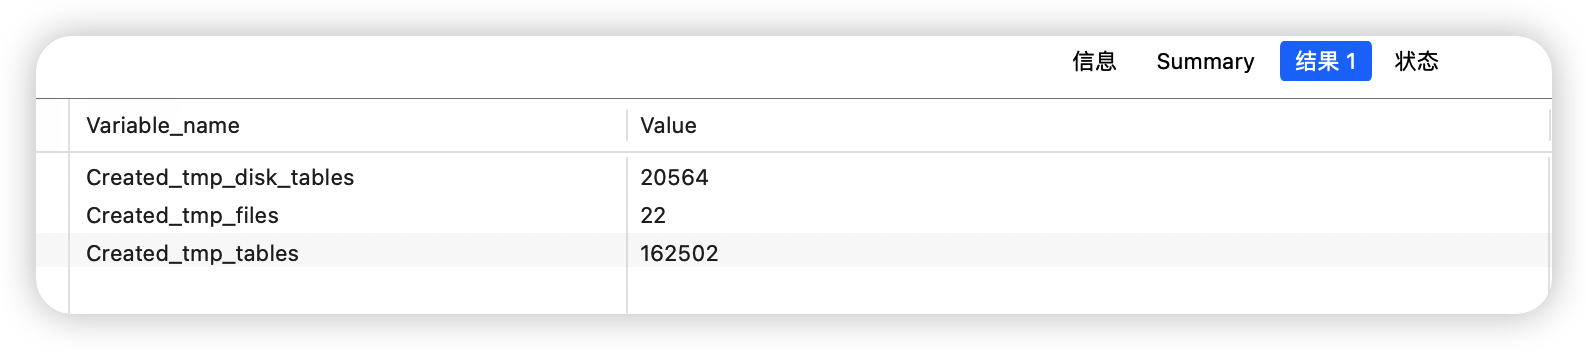
每次创建临时表,Created_tmp_tables增加,如果是在磁盘上创建临时表,Created_tmp_disk_tables也增加。
Created_tmp_files:表示MySQL服务创建的临时文件文件数,比较理想的配置是:
Created_tmp_disk_tables / Created_tmp_tables * 100% 比如上面的服务器 Created_tmp_disk_tables / Created_tmp_tables * 100% = 1.26%,应该相当好了。
# 打开表的数量
show global status like 'open%tables%';

# table高速缓存的数量
show variables like 'table_open_cache';
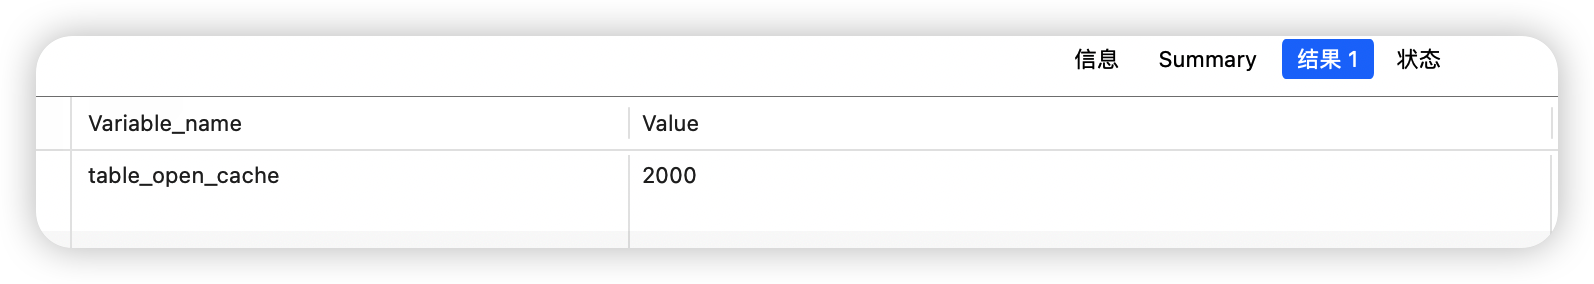
Open_tables / Opened_tables * 100% >= 81%
Open_tables / table_open_cache * 100%
比较合适的值为:
Open_tables / Opened_tables * 100% >= 85%
Open_tables / table_cache * 100% # 查看MySQL服务器的线程信息
show global status like 'Thread%';

# 当客户端断开之后,服务器处理此客户的线程将会缓存起来以响应下一个客户而不是销毁(前提是缓存数未达上限)
show variables like 'thread_cache_size';

# 查询缓存
show global status like 'qcache%';

Qcache_free_blocks:缓存中相邻内存块的个数。数目大说明可能有碎片。FLUSH QUERY CACHE会对缓存中的碎片进行整理,从而得到一个空闲块。
Qcache_free_memory:缓存中的空闲内存。
Qcache_hits:每次查询在缓存中命中时就增大
Qcache_inserts:每次插入一个查询时就增大。命中次数除以插入次数就是不中比率。
Qcache_lowmem_prunes:缓存出现内存不足并且必须要进行清理以便为更多查询提供空间的次数。这个数字最好长时间来看;如果这个数字在不断增长,就表示可能碎片非常严重,或者内存很少。(上面的 free_blocks和free_memory可以告诉您属于哪种情况)
Qcache_not_cached:不适合进行缓存的查询的数量,通常是由于这些查询不是 SELECT 语句或者用了now()之类的函数。
Qcache_queries_in_cache:当前缓存的查询(和响应)的数量。
Qcache_total_blocks:缓存中块的数量
# 查询缓存适用于特定的场景,建议充分测试后,再考虑开启,避免引起性能下降或引入其他问题
show variables like 'query_cache%';
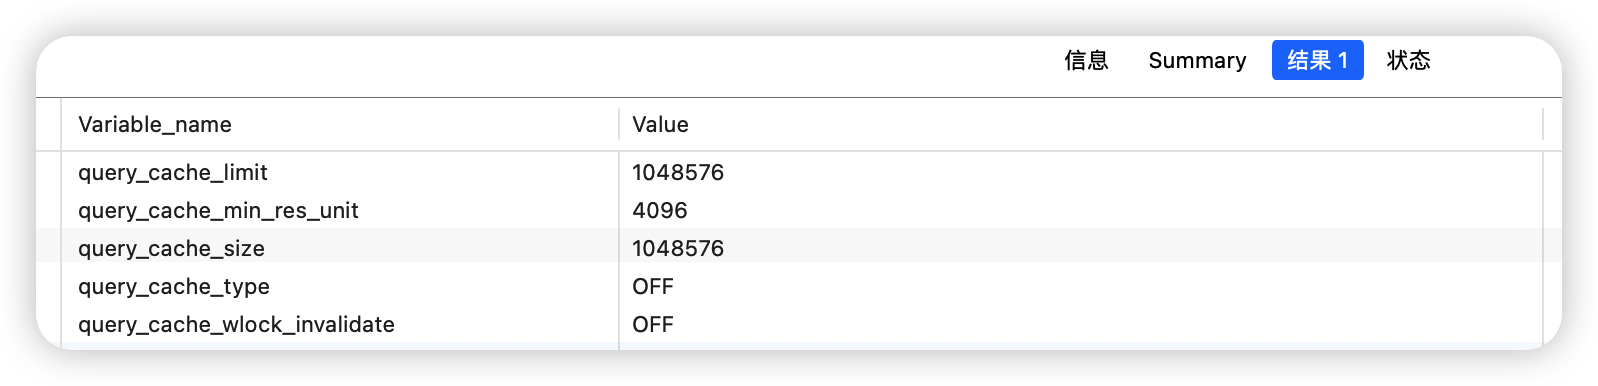
query_cache_limit:超过此大小的查询将不缓存
query_cache_min_res_unit:缓存块的最小大小
query_cache_size:查询缓存大小
query_cache_type:缓存类型,决定缓存什么样的查询
query_cache_wlock_invalidate:当有其他客户端正在对MyISAM表进行写操作时,如果查询在query cache中,是否返回cache结果还是等写操作完成再读表获取结果。
query_cache_min_res_unit的配置是一柄”双刃剑”,默认是4KB,设置值大对大数据查询有好处,但如果你的查询都是小数据查询,就容易造成内存碎片和浪费。
查询缓存碎片率 = Qcache_free_blocks / Qcache_total_blocks * 100%
如果查询缓存碎片率超过20%,可以用FLUSH QUERY CACHE整理缓存碎片,或者试试减小query_cache_min_res_unit,如果你的查询都是小数据量的话。
查询缓存利用率 = (query_cache_size - Qcache_free_memory) / query_cache_size * 100%
查询缓存利用率在25%以下的话说明query_cache_size设置的过大,可适当减小;查询缓存利用率在80%以上而且Qcache_lowmem_prunes > 50的话说明query_cache_size可能有点小,要不就是碎片太多。
查询缓存命中率 = (Qcache_hits - Qcache_inserts) / Qcache_hits * 100%
示例服务器 查询缓存碎片率 = 100%,查询缓存利用率 = 15.9%,查询缓存命中率 = 0%,命中率很差,可能写操作比较频繁吧,而且可能有些碎片。
# 文件打开数
show global status like 'open_files';

# 查看 mysqld进程能够打开的操作系统文件描述符(fd)的最大数量
show variables like 'open_files_limit';

Open_files / open_files_limit * 100% mysql> show global status like 'table_locks%';
# 表扫描情况
show global status like 'handler_read%';

# 服务器完成的查询请求
show global status like 'com_select';

出处:https://www.cnblogs.com/LoveBB/
本文版权归作者和博客园共有,欢迎转载,但未经作者同意必须在文章页面给出原文链接,否则保留追究法律责任的权利。
 登录查看全部
参与评论
手机查看
返回顶部